USDA Crop progress report was released today at 11am central slightly lowering corn and bean production, yield, and harvested area. The 14/15 grain ending stocks for corn beans and wheat came in below the average estimate. 13/14 world ending stocks and 14/15 world ending stocks for corn beans and wheat all came in below the average estimate.
| USDA 2014/15 U.S. Production (Mill. bushels) | USDA | Average Estimate | Range of Estimates | Last Yr. |
| Corn | ||||
| Production | 14,474 | 14,506 | 14,063-14,958 | 13,925 |
| Yield (bu/acre) | 174.2 | 174.7 | 172.0-178.4 | 158.8 |
| Harvested Area (mill acre) | 83.1 | 83.158 | 81.6-84.4 | 87.668 |
| Soybeans | ||||
| Production | 3927 | 3976 | 3880-4104 | 3358 |
| Yield (bu/acre) | 47.1 | 47.6 | 46.9-48.8 | 44 |
| Harvested Area (mill acre) | 83.4 | 83.621 | 82.45-84.1 | 76.253 |
| USDA 2014/15 U.S. Grain Ending Stock (Mill. Bushels) | ||||
| Corn | 2.081 | 2,130 | 1,785-2,518 | 1181 |
| Soybeans | 450 | 472 | 376-550 | 130 |
| Wheat | 654 | 704 | 625-736 | 590 |
| USDA 14/15 World Ending Stocks (Mill. Tonnes) | ||||
| Corn | 190.6 | 192 | 188.0-200.2 | 173.1 |
| Soybeans | 90.7 | 90.8 | 88.5-96.9 | 66.9 |
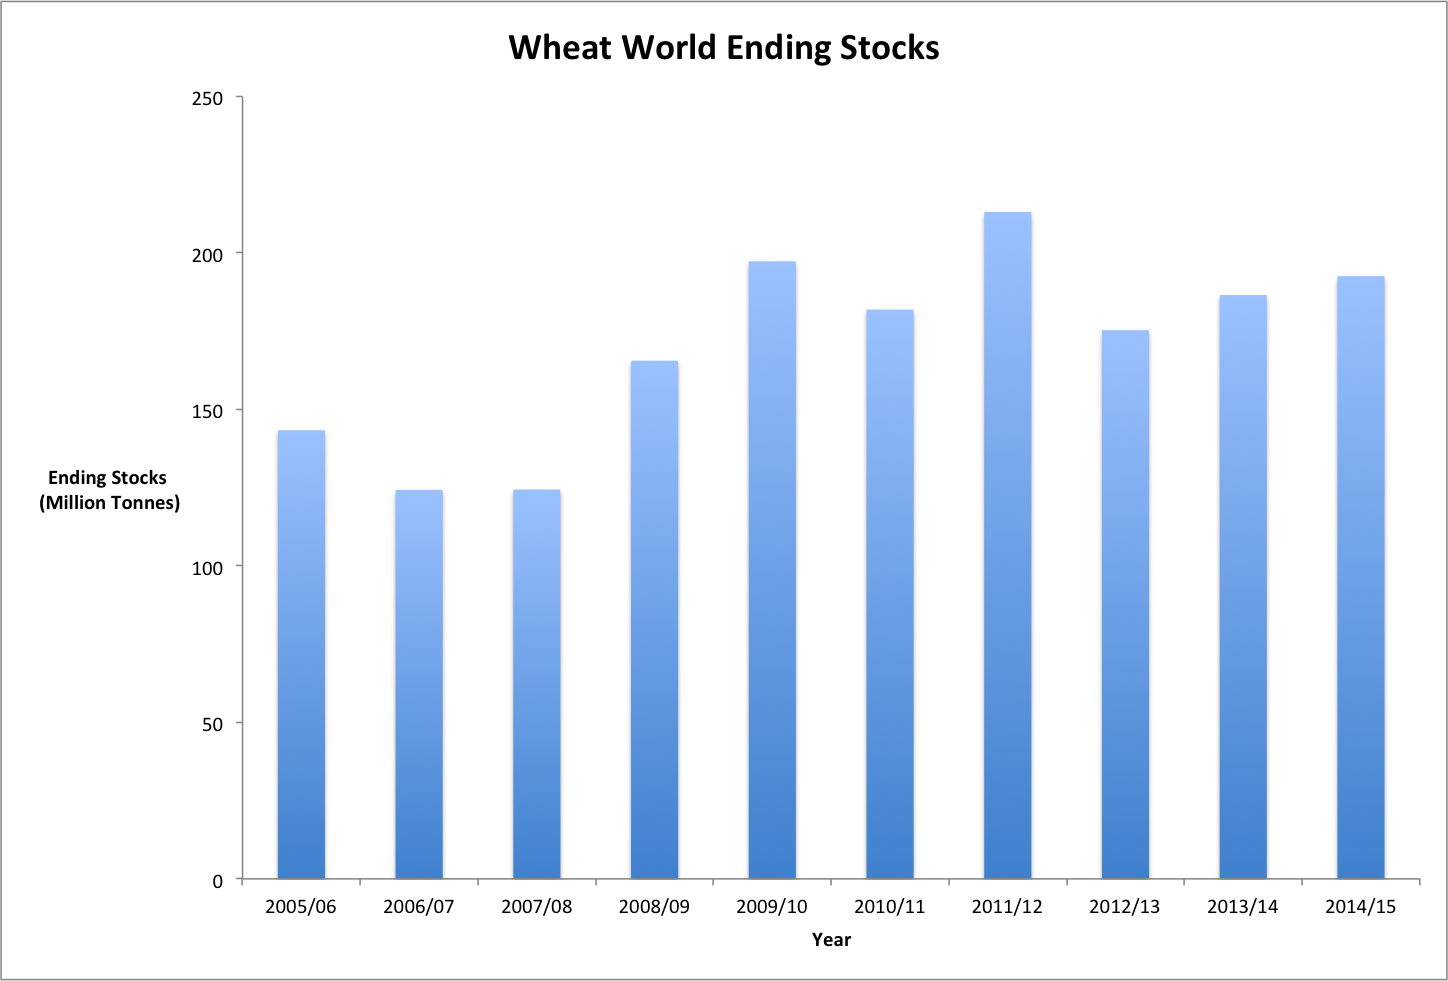
| Wheat | 192.6 | 196.4 | 190.0-198.1 | 186.5 |
| USDA 13/14 World Ending Stocks (Mill Tonnes) | ||||
| Corn | 173 | 173.7 | 172.2-175 | 138.2 |
| Soybeans | 66.49 | 66.2 | 65.0-68.0 | 56.8 |
| Wheat | 185.58 | 186.8 | 186.0-188.3 | 175.6 |